Key takeaways:
- Stop “Data-Dumping” Your audience will ignore raw statistics. Posting a number (“The market will be $1.81T”) is a fact, not a story, and fails to engage.
- Practice “Data-Driven Storytelling” The real goal is to provide the “so what.” Wrap your data in a human-centric narrative, give it context, emotion, and a clear “why it matters” to create a compelling wake-up call.
- Build Authority and Trust Using stats to support your story builds instant credibility. This method positions you as an expert and gives B2B buyers the persuasive proof they need to trust your message.
Ever stare at your LinkedIn dashboard, wondering why that brilliant post you spent an hour crafting just… sank?
You’re not alone. The LinkedIn feed is a crowded, noisy, and frankly, brutal place. In the sea of “I’m thrilled to announce” and recycled business quotes, just having an opinion isn’t enough. You need to back it up.
This is where most marketing teams hit a wall. They either post “fluff” (all opinions, no substance) or “data-dumps” (all numbers, no soul). Both are invisible.
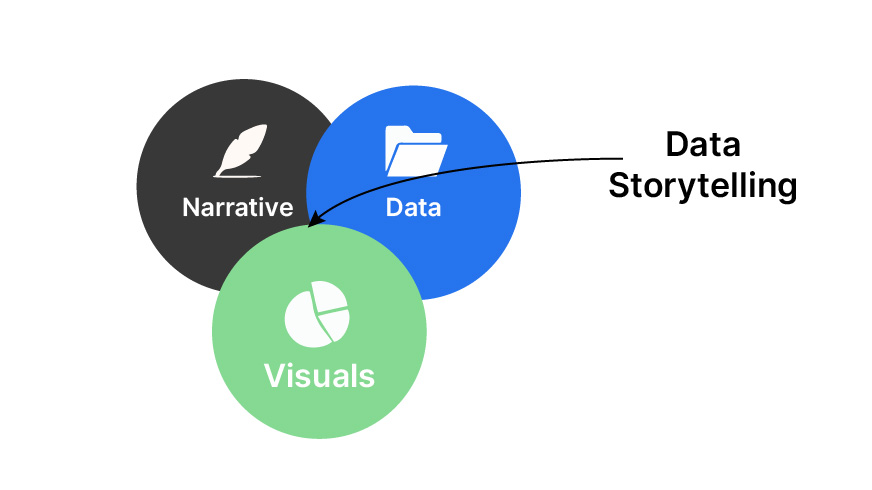
The real magic, the secret to stopping the scroll, isn’t just data. It’s data-driven storytelling.
First, Let’s Clear the Jargon
Before we get to the “how-to,” let’s agree on what we’re talking about. These terms get thrown around a lot, but at Glofinity.ai, we see them as powerful, distinct tools:
- Industry Stat: This is your “what.” It’s a hard, objective piece of data from a credible source (think Gartner, Forrester, Forbes, or even your own company’s internal reports).
- Example: “The global AI market is projected to reach $1.81 trillion by 2030.”
- Data-Driven Storytelling: This is your “so what?” It’s the human-centric narrative you build around that stat. It’s the art of giving a number context, emotion, and a C-suite-level “why it matters.”
- Compelling LinkedIn Content: This is the goal. It’s a post that doesn’t just get a like; it gets a “Wow, I never thought of it that way,” a comment, a share, or a new sales lead.
Stop Data-Dumping! Start Storytelling.
Here’s the single biggest mistake professionals make on LinkedIn: A stat is not a story.

Just posting “The global AI market will reach $1.81 trillion by 2030” is lazy. Your audience just scrolls by and thinks, “Okay… and?”
Now, watch how we reframe it using storytelling:
Bad (Data-Dump): “The global AI market is projected to reach $1.81 trillion by 2030.”
Good (Storytelling Hook): “In 6 years, the AI market will be worth $1.81 trillion. That’s not a ‘boom’; it’s a new industrial revolution. The scary part? Many businesses are still operating like it’s 2014. Is your strategy ready for that world, or will you be a relic in a trillion-dollar industry?”
See the difference? The first is a fact. The second is a wake-up call.
Why Your Audience Craves Data (Even If They Don’t Know It)
In the B2B world, decisions aren’t made on vibes. They’re made on ROI, proof, and risk reduction. Your LinkedIn content should reflect that.
Stats build instant credibility
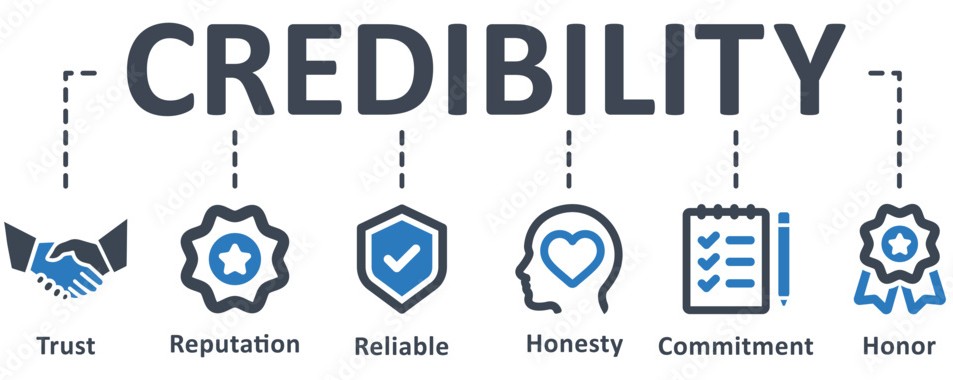
A claim like, “Our solution makes marketing teams better” is weak. A claim like, “Data-driven organizations are 23 times more likely to acquire customers (Forbes)” makes you a trusted authority.
You’re not just a vendor; you’re an expert who has done the research. In fact, a B2B Marketing study found that 78% of B2B buyers find content with relevant data and stats more persuasive. You’re literally giving them what they want.
A 5-Step Playbook for Your Next Data-Driven Post
Ready to craft your own? Here’s our internal framework.
1. Find Your “Golden” Stat Don’t just Google “marketing stats.” Look for a number that’s surprising, challenging, or confirms a new trend. Find data that can act as the villain or the hero of your story.
- Pro-Tip: Your own company’s data is a goldmine. “We analyzed 1,000 marketing campaigns and found…” is 100x more powerful than a recycled stat.
2. Build the “Human” Frame (The P-A-S Model) Wrap your stat in a story. We love the Problem-Agitate-Solve model.
- Problem: “We all know LinkedIn engagement is tough to earn.”
- Agitate: “You spend hours on content just to see it vanish in 30 minutes. It feels like shouting into the void.”
- Solve (The Stat): “But what if the answer was simple? LinkedIn’s own data shows posts with statistics can see up to 8x more engagement. The fix isn’t shouting louder; it’s shouting smarter.”
3. Visualize the Number LinkedIn is a visual platform. Don’t just say the number; show it.
- Turn a percentage into a simple pie chart.
- Turn a growth number into a clean bar chart.
- Even just putting the big number on a simple, branded graphic can stop the scroll.
4. Add Your Unique Insight (This is the “Glofinity” move) The stat is public. Your interpretation is proprietary. This is where you connect the data point back to your company’s unique value.
- The Stat: “60% of small businesses still don’t use data analytics.”
- Your Insight: “We see this stat and don’t just see a number. We see millions of dollars in wasted ad spend. We see guesswork instead of strategy. That’s not a business problem; it’s a growth problem. The good news? It’s fixable.”
5. End with a Sharp Question Don’t end with “Thoughts?” It’s lazy. Ask a specific, data-related question that invites a real response.

- Instead of: “What do you think?”
- Try: “What’s the one metric you’re tracking this quarter that tells you the real story?”
- Or: “When it comes to data, is your team more focused on ‘what happened’ or ‘what’s next’?”
Your Data Has a Story. Let’s Tell It.
At the end of the day, numbers are just numbers. They don’t have a heartbeat.
It’s your job as a marketer and a leader to give them one.
Turning complex analytics into a compelling narrative that drives leads, positions you as a thought leader, and actually grows the bottom line, that’s the real skill.
At Glofinity.ai, we don’t just find the data. We find the story.
Ready to see what your data really says? Let’s talk.

Frequently Asked Questions (FAQs)
1️⃣ What exactly is “data-driven storytelling”?
It’s the blend of hard data and human emotion. Instead of dumping stats, you use them to tell a story that connects insight to impact , making your audience feel the data, not just read it.
2️⃣ Why do most LinkedIn posts with stats fail to perform?
Because they stop at the number. A figure like “The AI market will hit $1.8T” means nothing without context. You need to turn data into a narrative that sparks curiosity and conversation.
3️⃣ How can I find the right industry stats for my content?
Look for data that surprises, challenges, or validates a new trend.
✅ Use trusted sources like Gartner, Forrester, and Forbes.
✅ Better yet mine your own company data. It’s unique, credible, and builds authority.
4️⃣ What’s the best way to visualize data on LinkedIn?
Keep it simple and bold. Use clean pie charts, bar charts, or branded number graphics that summarize your key insight. Visuals break the scroll and make your message instantly digestible.
5️⃣ How does data-driven content build trust with B2B audiences?
B2B buyers crave proof over promises. When your insights are backed by credible stats, you shift from self-promotion to thought leadership , positioning your brand as a reliable, data-smart partner.
6️⃣ What’s the “Glofinity Move” in storytelling?
It’s our signature twist ; we don’t just present the data, we decode its meaning. We translate analytics into real-world impact, turning numbers into narratives that inspire decisions.
7️⃣ How often should I use stats in my LinkedIn posts?
Use them strategically, not excessively. One powerful, well-explained stat can do more for engagement than ten unconnected ones. Quality storytelling > quantity of numbers.
8️⃣ What’s one quick tip to make my next post more data-driven?
Start with a relatable pain point, add one credible stat, and end with a sharp, data-related question ; something that makes readers stop, think, and respond.
9️⃣ How can Glofinity.ai help me craft better LinkedIn content?
At Glofinity.ai, we specialize in turning raw data into scroll-stopping stories. From AI-driven analytics to strategic storytelling, we help brands translate insights into influence.